What is NPS — and why does it matter?
Net Promoter Score (NPS) is one of the most widely used metrics for measuring customer loyalty. It asks users a single, simple question:
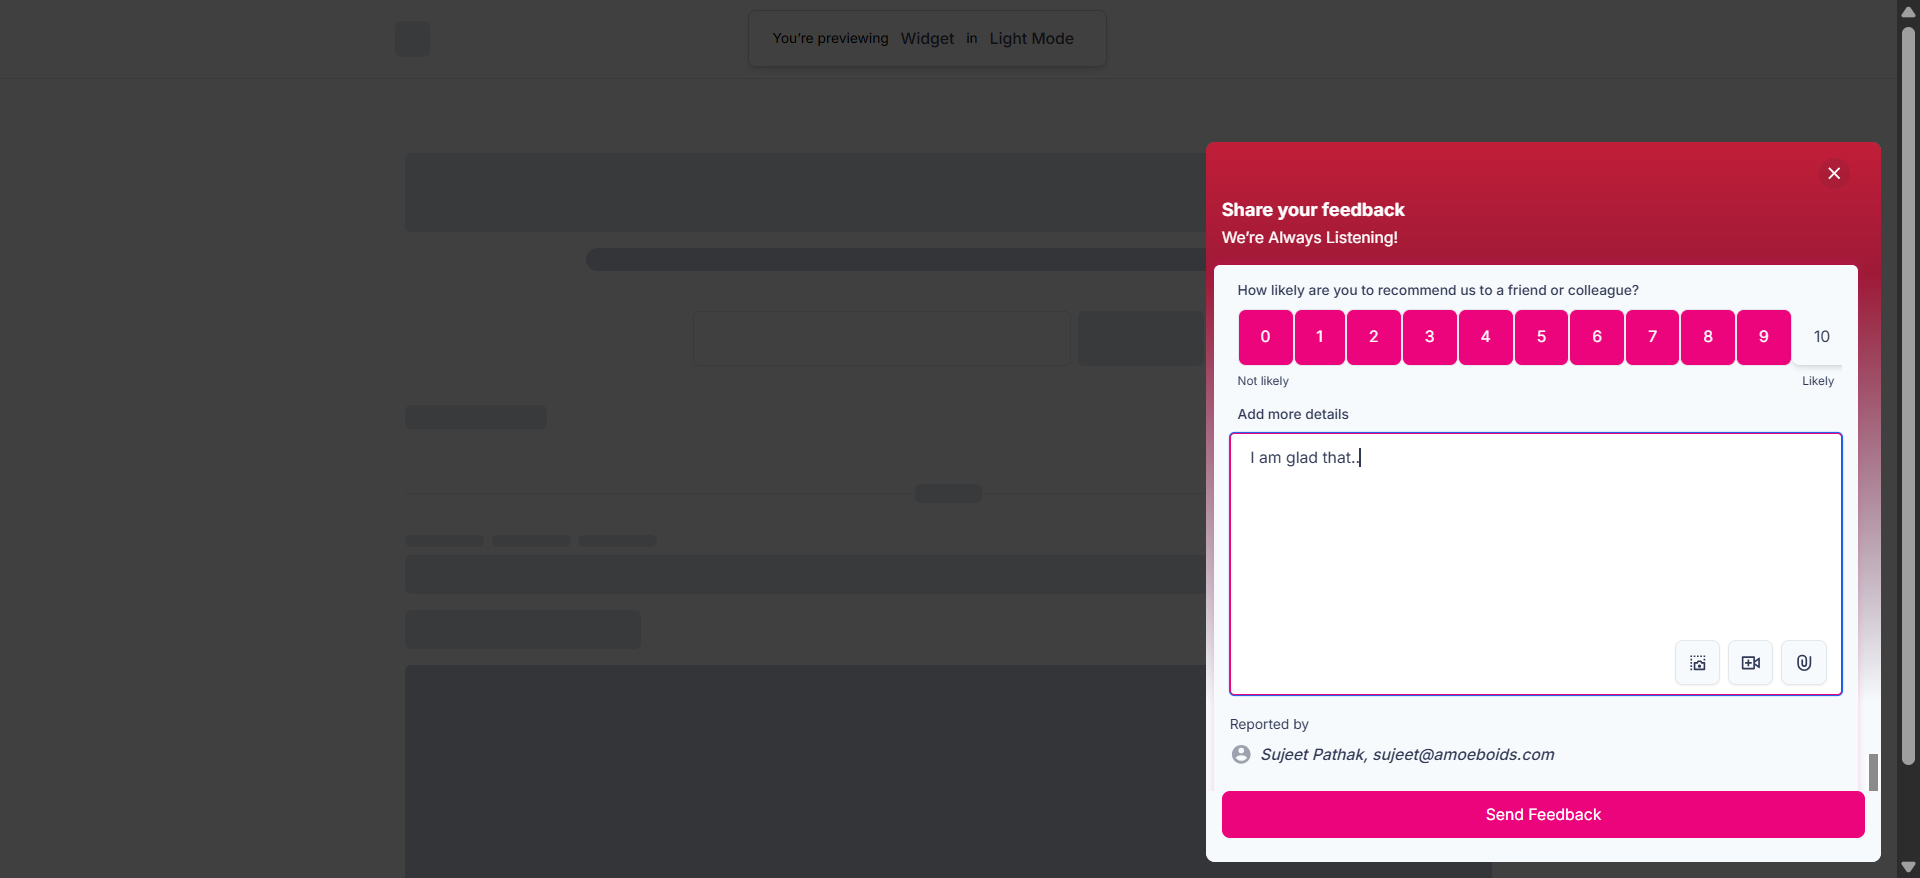
"How likely are you to recommend us to a friend or colleague?"
Users respond on a scale of 0 to 10. Based on their score, they fall into one of three categories:
| Score | Category | What it means |
|---|---|---|
| 9–10 | Promoters | Loyal enthusiasts who will recommend your product |
| 7–8 | Passives | Satisfied but not enthusiastic — vulnerable to competitors |
| 0–6 | Detractors | Unhappy users who may actively discourage others |
Your NPS score is calculated as:
NPS = % Promoters − % Detractors
NPS ranges from −100 to +100. A positive score means you have more promoters than detractors. Scores above 50 are considered excellent.
Beyond the number itself, NPS is most valuable when paired with a follow-up open-ended question — "What's the main reason for your score?" — which reveals the specific drivers behind user sentiment. This is where Olvy's NPS widget goes beyond a simple survey.
How Olvy's NPS Widget Works
Olvy's NPS widget is an in-app survey that you embed directly inside your product. It handles the entire NPS workflow automatically.
- Appears at the right time — You control when users first see it, how long to wait before showing it again after a dismissal, and how long to cool down after a completed response.
- Collects the score + follow-up — Users rate on a 0–10 scale, then optionally answer a follow-up question.
- Logs responses automatically — Every response is captured in Feedback → Sources in your Olvy workspace.
- AI extracts actionable feedback — Olvy AI reads each raw response and automatically extracts structured feedback into Feedback → Inbox, ready for your team to review, tag, prioritize, and act on — with no manual effort.
- Surfaces insights in Analytics — A dedicated analytics dashboard tracks your NPS score, promoter/detractor breakdown, and response trends over time.
Configuring your NPS Survey
The NPS widget is configured through a 4-step wizard in Olvy.
Step 1: Questions
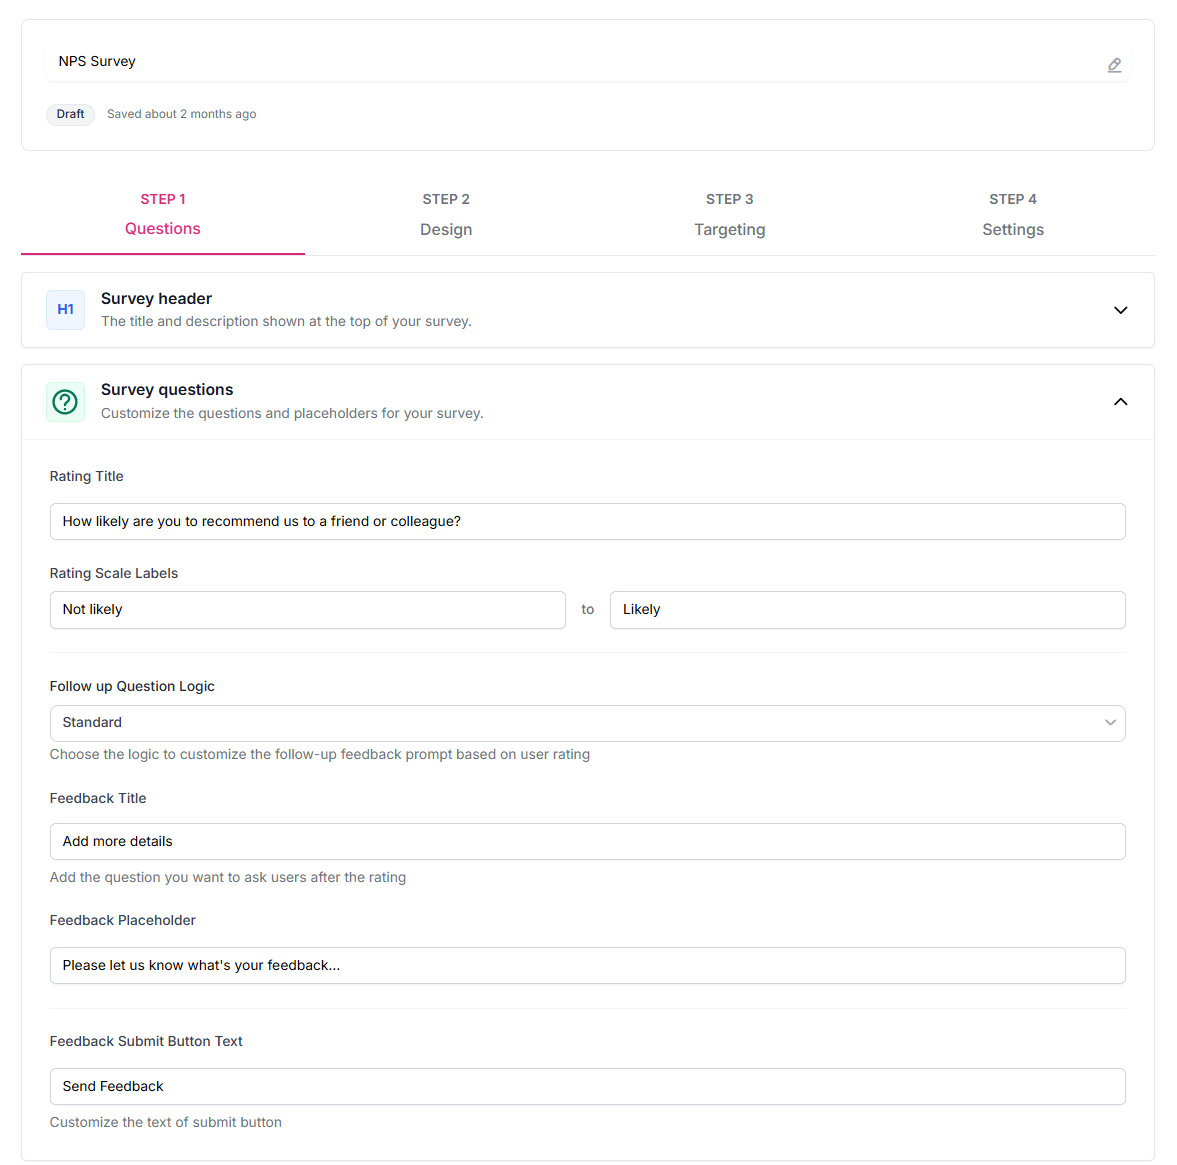
Survey Header Set the title and description shown at the top of the widget — for example, "Share your Feedback" and "We're Always Listening!"
Survey Questions
- Rating Title — The NPS question shown to users. Default: "How likely are you to recommend us to a friend or colleague?"
- Rating Scale Labels — Labels for the low and high ends of the 0–10 scale (e.g. "Not likely" → "Likely").
- Follow-up Question Logic — Choose how the follow-up prompt behaves after the user selects a score:
- Standard — One follow-up question shown to all users regardless of score.
- Conditional — Different follow-up questions based on the score range (e.g. a different prompt for detractors vs promoters, letting you dig deeper where it matters most).
- Feedback Title — The follow-up question text (e.g. "What's the main reason for your score?").
- Feedback Placeholder — Placeholder text inside the follow-up input.
- Submit Button Text — Customize the label on the submit button.
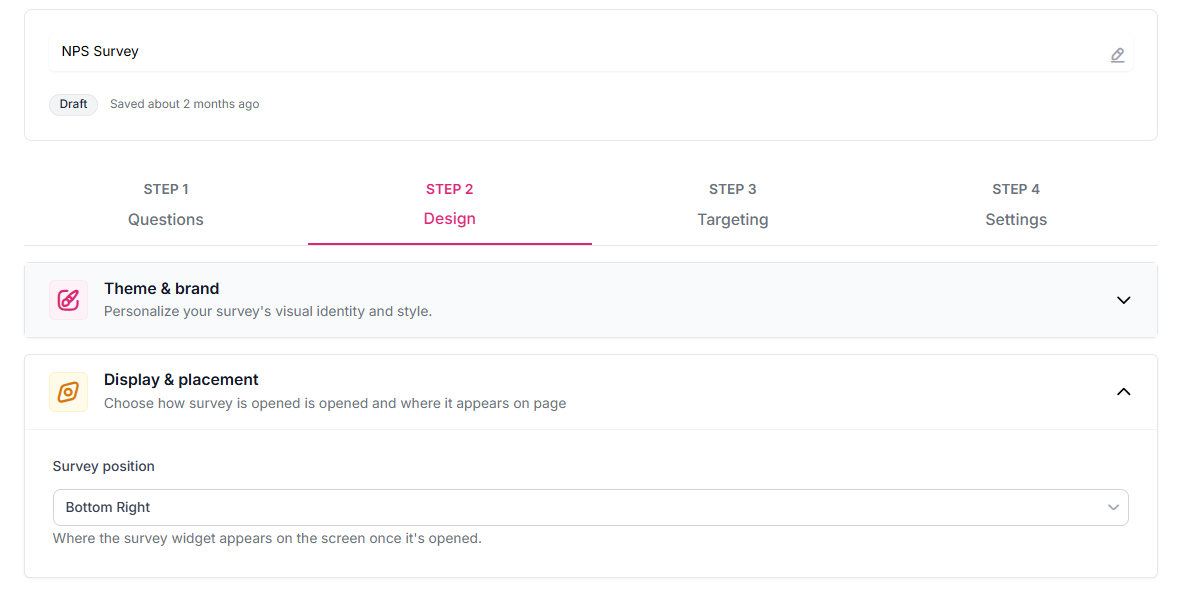
Step 2: Design
Theme & Brand
- Set your color theme (Light mode, or follows system preference).
- Apply your brand color to the widget.
- Toggle a background overlay when the widget is open.
- Fine-tune colors for headers, inputs, borders, and more.
Display & Placement
- Survey Position — Where the widget appears on screen (e.g. Bottom Right).
Step 3: Targeting
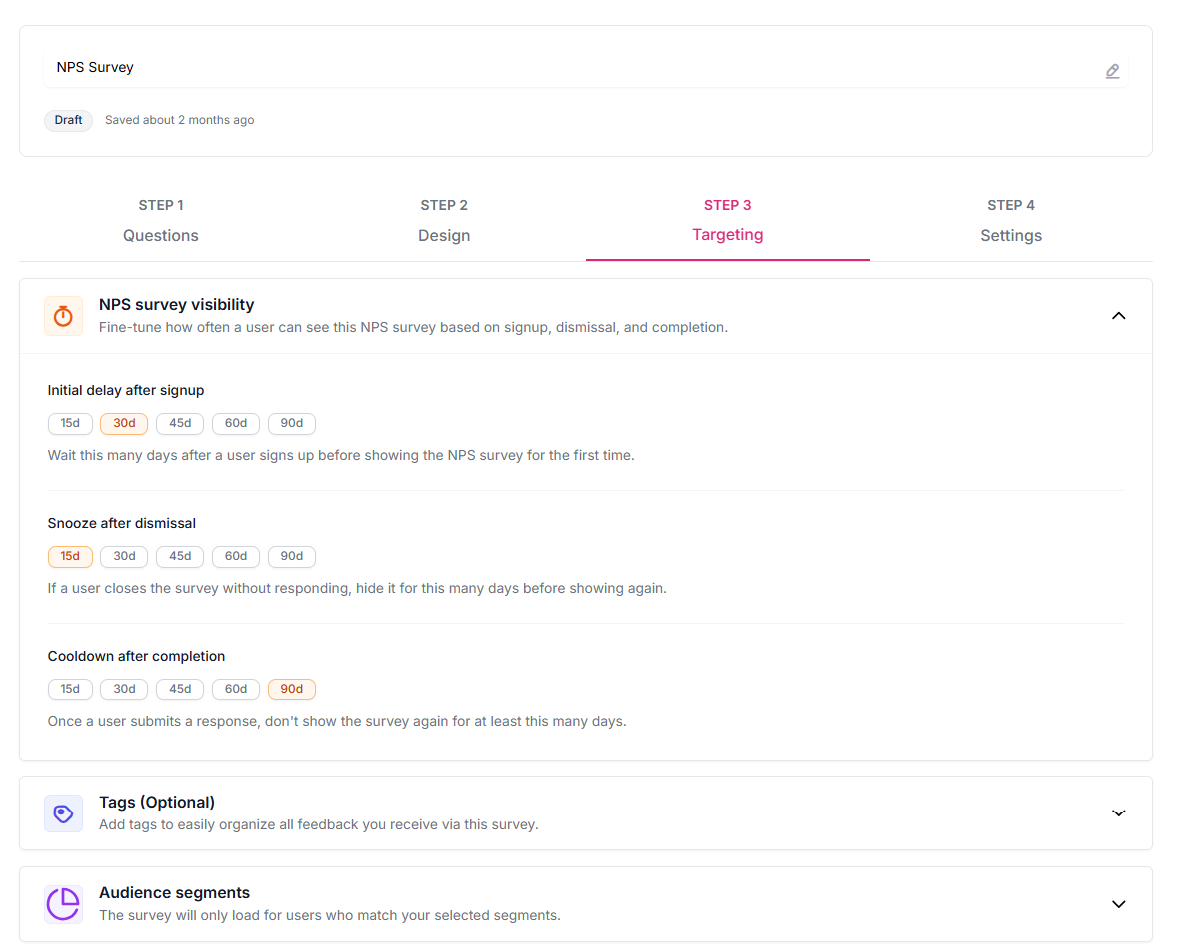
NPS Survey Visibility
This is where you control the cadence of your NPS survey — critical for getting reliable data without fatiguing your users:
- Initial delay after signup — How many days to wait after a user signs up before showing the NPS survey for the first time. Options: 15, 30, 45, 60, or 90 days. This ensures you're collecting feedback from users who have had enough time to form a real opinion.
- Snooze after dismissal — If a user closes the survey without responding, hide it for this many days before showing it again. Options: 15, 30, 45, 60, or 90 days.
- Cooldown after completion — Once a user submits a response, don't show the survey again for at least this many days. Options: 15, 30, 45, 60, or 90 days. This prevents users from being re-surveyed too soon after already responding.
Tags (Optional) Assign tags to this survey so responses are automatically categorized when they arrive in your inbox.
Audience Segments Restrict the survey to specific segments of your user base — for example, only show it to users on a paid plan, or users who have been active in the last 30 days.
Step 4: Settings (Optional)
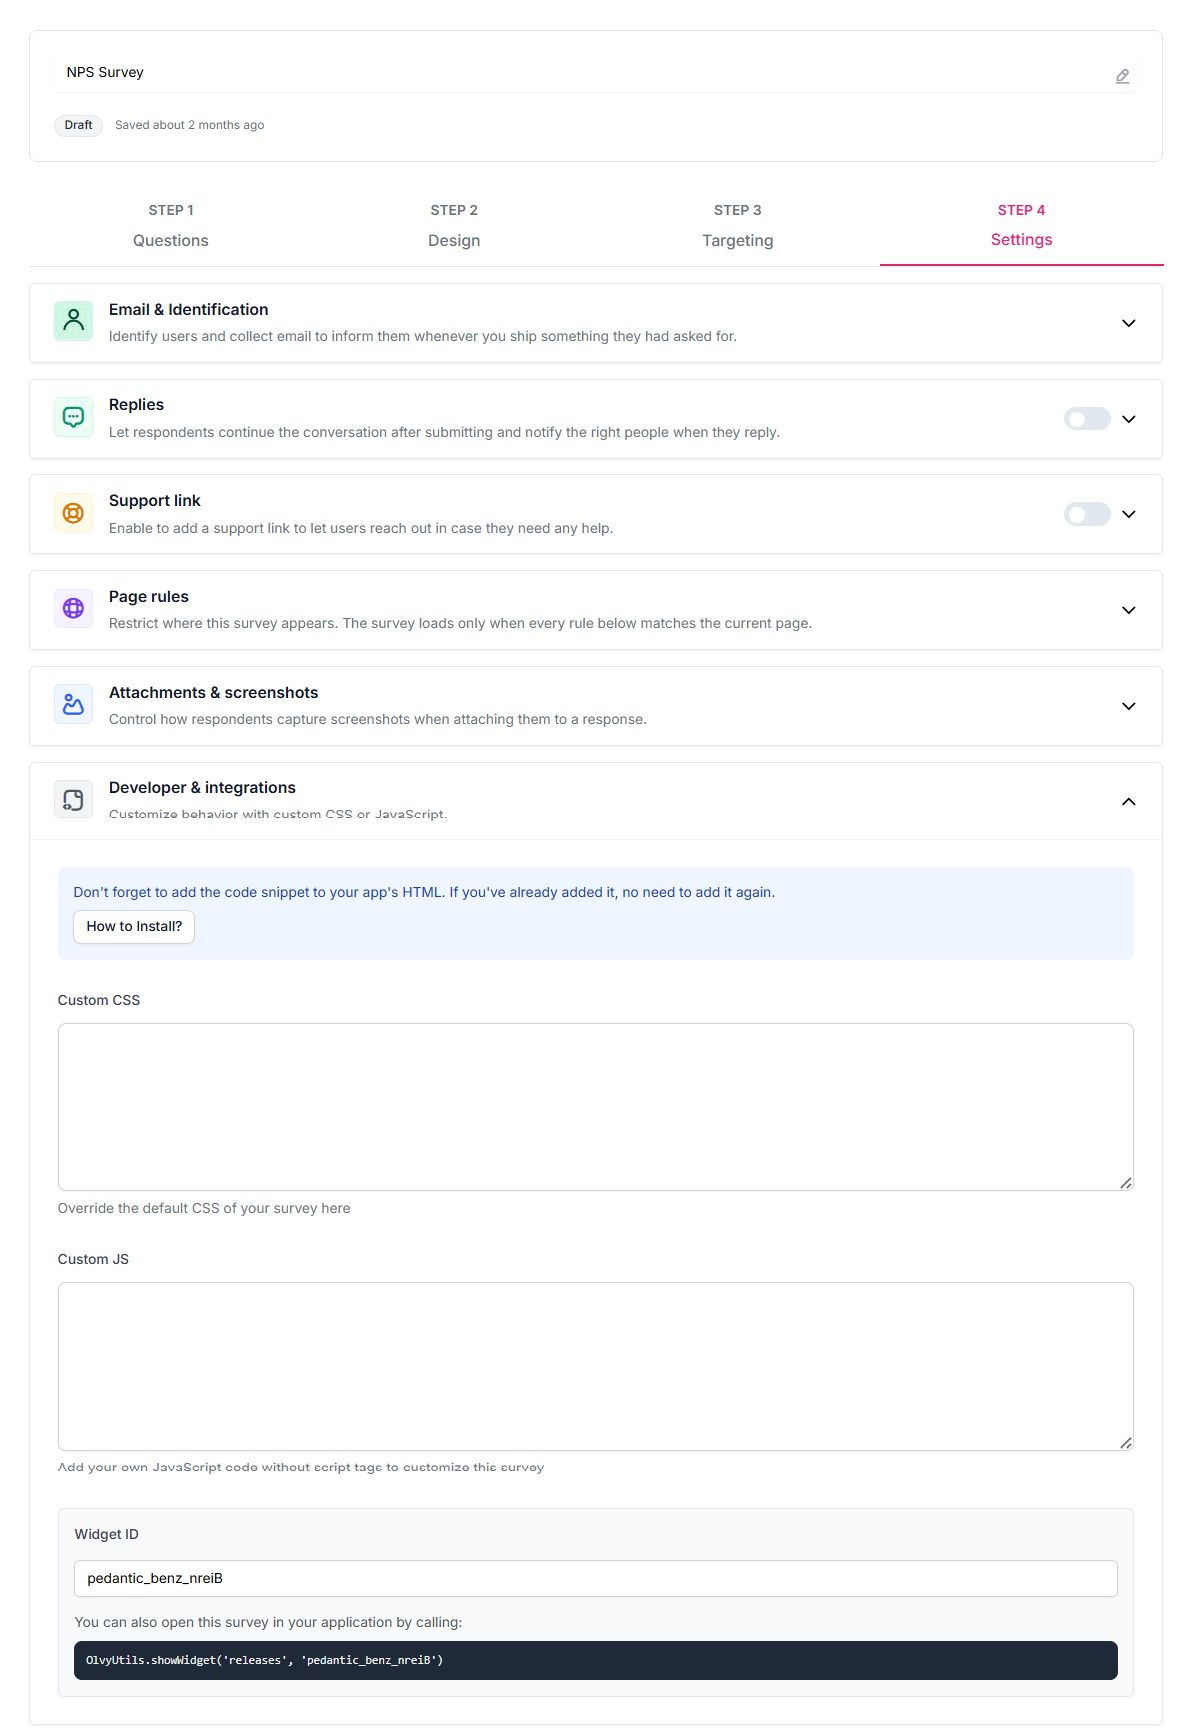
- Email & Identification — Optionally collect user email alongside the response. If users are already identified in your app via Olvy's user identification, their details are attached automatically.
- Replies — Enable to let users continue the conversation after submitting, and notify your team when they do.
- Support Link — Add a support link inside the widget for users who need immediate help.
- Page Rules — Restrict which pages the survey appears on.
- Developer & Integrations — Access your Widget ID for programmatic control, add custom CSS or JavaScript.
Installing the NPS Widget
Once your survey is configured, click "How to Install?" in the top bar of the editor for step-by-step installation instructions. The guide covers:
- Adding the Olvy script to your app (HTML, React, Vue, or Angular)
- Identifying your users programmatically so responses are always tied to the right person
- Triggering the widget from your own code using the Widget ID at appropriate place.
Need help getting set up? Reach out to us.
Responses & AI Processing
Every time a user submits an NPS response, Olvy handles the downstream processing automatically.
Feedback → Sources
Raw responses are logged here as they come in. Each entry contains the user's NPS score, their follow-up response text, and any available user identification details. This gives you a complete, unfiltered record of every submission.
Feedback → Inbox (AI-powered)
Olvy AI reads each raw response from Sources and automatically extracts structured feedback — identifying the sentiment, the underlying theme, and any specific product signals — and logs them into your Feedback Inbox. From there, your team can:
- Review and interpret each piece of feedback
- Tag and categorize it
- Link it to features, roadmap items, or issues
- Take action or follow up with the user directly
No manual triaging or copy-pasting required. The AI does the heavy lifting so your team can focus on acting on what users are telling you.
Analytics
Each NPS survey has a dedicated analytics dashboard accessible from your Surveys list. It gives you a clear picture of how your NPS is trending over time.
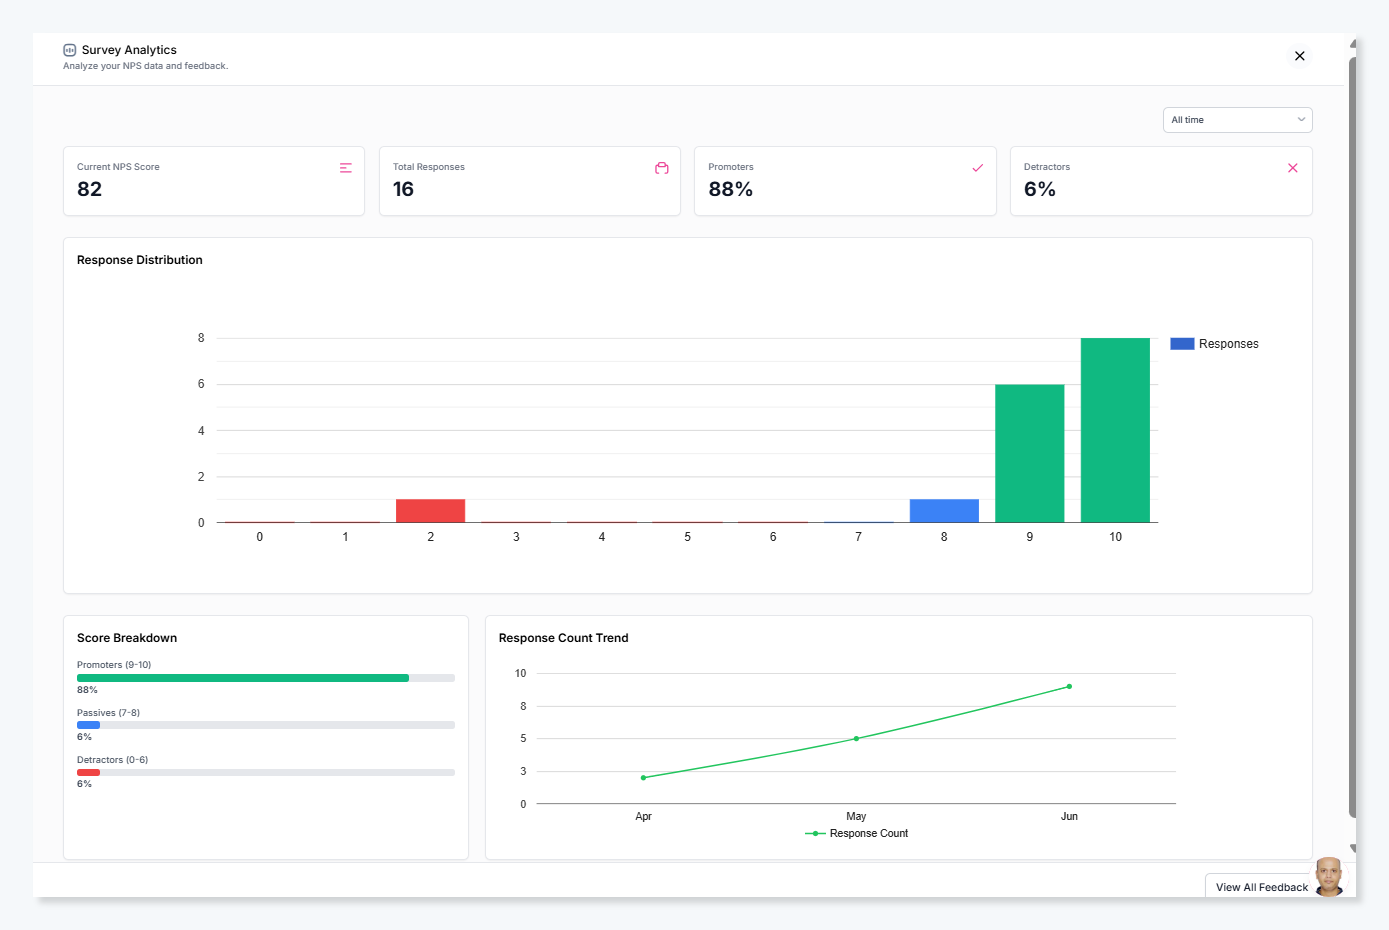
Summary Metrics
Four top-level numbers at a glance:
- Current NPS Score — Your live NPS calculated from all responses in the selected time period.
- Total Responses — The total number of survey submissions received.
- Promoters % — The percentage of respondents who scored 9–10.
- Detractors % — The percentage of respondents who scored 0–6.
Response Distribution
A chart showing how responses are distributed across each score from 0 to 10. This helps you see at a glance where users are clustering — whether most responses are in the promoter range, or whether there's a concentration of low scores that needs attention.
Score Breakdown
A bar chart breaking down the percentage of responses in each category:
- Promoters (9–10)
- Passives (7–8)
- Detractors (0–6)
Response Count Trend
A time-series chart showing how the volume of responses has changed over the selected period. Useful for spotting whether survey fatigue is setting in, or whether a product change drove a spike in responses.
You can filter all analytics by time period using the dropdown in the top right (e.g. Last 30 days, All time).
Related articles
https://olvy.co/docs/widgets/user-identification/
https://olvy.co/docs/widgets/additional-feedback-information/